
I like measuring things. There’s something about distilling life’s patterns into numbers which is deeply satisfying. I can’t explain it. But this is, at least in part, why I became a scientist.
About a year ago, I started exercising this obsession on my everyday life, and built a number of sensors out of Raspberry Pis to monitor the goings on in my house. This has variously fluctuated between one and three Pis, but at present I have two, one monitoring internal and external temperature, and internal light and humidity levels, and one measuring electricity usage by counting the pulses of the LED on my proprietary electricity meter.
So in the spirit of the end of the year, and our collective obsession with summarising the year’s goings on, in this post I am going to start to analyse the fruits of one of my obsessions: a whole year of data collected by Raspberry Pi. I’m planning to delve deeply into this data over a number of future posts, and to summarise the main features in an infographic (having been inspired by The information capital and Knowledge is beautiful).
In this post, I’m just going to talk about what the sensors are, and give a quick(ish) introduction to what sort of data they collect, and some examples of what can be gleaned from it.
The setup
I am currently running two Raspberry Pis: an early model B which is plugged directly into my router, and a more recent A+ which communicates with the router via Wi-fi.
Raspberry Pi B
The Raspberry Pi B does the temperature, light, and humidity sensing, using two DS18b20 digital temperature sensors (one internal, one external), and a DHT22 temperature and humidity sensor. To detect light, it simply uses an analogue light dependent resistor (LDR) hooked up to a capacitor, which will give a digital signal when full. Timing the pause between signals allows a crude measure of light intensity to be recorded. At some point I will produce some circuit diagrams, and publish these, but at present the software is available on github.
Simply put, the python code polls the sensors and returns a reading for each sensor, which is combined into a text string and written either to screen, csv, or a postgres SQL database (or a combination of the three).
Before moving to postgres, I was syncing readings over Dropbox, and I continue to retain this functionality as a backup, in case my internet connection drops, and the Pis are unable to contact the postgres database (currently hosted on an AWS EC2 instance).
This pi also produces a daily report using R, which it emails me via gmail at 09:00 every morning. This saves me the effort of having to log into the database, and lets me keep an eye on the house when I am away.
Raspberry Pi A+
The A+ sits inside my electricity meter cabinet, and uses another LDR to monitor the pulses of an LED on the meter itself. Each pulse equates to 0.001 of a kilowatt hour. It records the pulses over a minute, and outputs this value to a text file (pushed to dropbox at 02:00 each morning), and updated immediately to the postgres server.
The code (and more comprehensive documentation) is available on github.
The data
So the basics. This excerpt is about 11 months’ worth of data, with just over a million observations in the raw datasets.
| Start date | End date | Duration (days) | Number of observations |
|---|---|---|---|
| 2015-01-02 15:18:00 | 2015-12-01 00:54:00 | 332 | 1,080,654 |
Taking a slightly more detailed look. this equates to about 69% of the possible electricity measurements during that period, and 94% of possible measurements from the other sensors. I didn’t start recording electricity meter readings until later in the year, and I’ve had some issues with the Raspberry Pi A+ which have meant some missing values.
The code is a lot more precarious for the electricity meter reader. The code for the other sensors can be simple: take a reading and push that reading to postgres. The A+ currently collects data on a while loop, and pushes updates to postgres every minute. This format is much more unstable than using crontab (as on the B), and leads to a lot more crashes, which if undetected can lead to several days of lost data. I’ll upgrade this one day soon to use interrupts instead, but for now I get the A+ to reboot at 04:00 every day.
| key | n | possible | actual (%) |
|---|---|---|---|
| Electricity | 329,359 | 478,080 | 68.9 |
| External temperature | 150,259 | 159,360 | 94.3 |
| Internal humidity | 150,259 | 159,360 | 94.3 |
| Internal light | 150,259 | 159,360 | 94.3 |
| Internal temperature 1 | 150,259 | 159,360 | 94.3 |
| Internal temperature 2 | 150,259 | 159,360 | 94.3 |
Plotted out, the raw data look like this (in fact I have removed a few values from the temperature and light readings to get sensible scales for the y-axis).
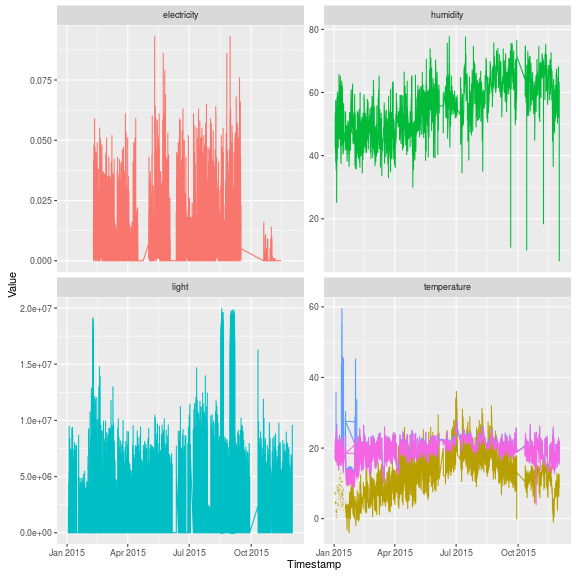
The gaps in measurements are pretty obvious, as are some erroneous looking values. In this plot the light values are essentially counts of how long it took to fill the capacitor (thus allowing a digital input from an analogue sensor). It makes sense to log these values and multiply by -1 to get a more intuitive plot, but I’ll do that later.
Cleaning
I’ve gone through a couple of steps to clean up this data, all of which are include on github in the .Rmd file from which this page is compiled, but in brief the process was to:
- Average the two temperature readings into a single
int_tempreading. - Calculate $\delta$ (the difference between $t$ and $t+1$) and use a daily window function to identify and remove absolute values of $\delta$ greater than six times the mean absolute deviation above the median $\delta$ - i.e. very extreme outliers. This was not done for light readings.
- Remove the entire day of light measurements for days where the light value (capacitor fill time) was greater than 10,000,000 and any individual values greater than 25,000,000. The rationale being that the sensor sometimes gets knocked over, or things put in front of it (like Xmas cards!).
- A range of dates were identified as problematic, and removed:
- 2015-02-08 (all except electricity).
- 2015-06-03 to 2015-06-12 (electricity).
- 2015-04-16 to 2015-04-02 (electricity).
After removing these records, I was still able to retain at least 77% of possible measurements for the period, with the exception of electricity measurements, which dropped to 57%. Still, a pretty representative record of my year.
| key | n | possible | actual (%) |
|---|---|---|---|
| Electricity | 272,894 | 478,080 | 57.1 |
| Internal humidity | 122,054 | 159,360 | 76.6 |
| Internal light | 133,799 | 159,360 | 84.0 |
| Internal temperature | 108,477 | 159,360 | 68.1 |
| External temperature | 128,753 | 159,360 | 80.8 |
Plotting this out, the data look a lot more consistent.
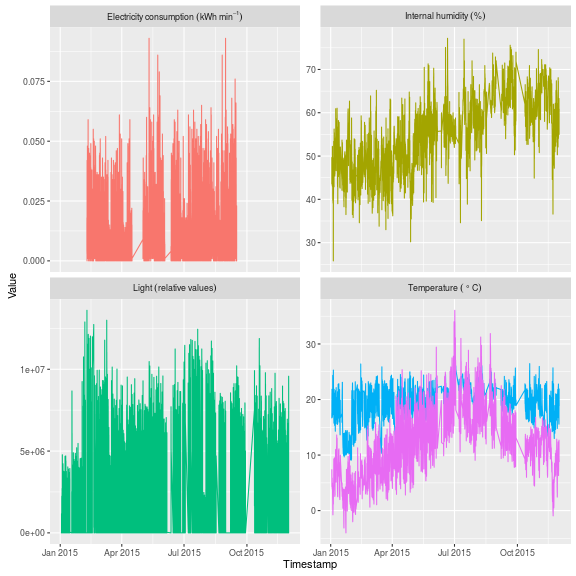
Note that there are still some periods which raise some concern - e.g. light measurements and internal temperature in January/February.

In the former case, this was because I moved the location of the sensor in early February to a darker location (leading to longer capacitor timings). In the latter, I went on holiday for a couple of weeks, hence external temperature remained unaffected, but internal temperature dropped by almost 10 degrees Celsius. In fact these holiday periods could become a useful benchmark for identifying patterns from my activities in the data.
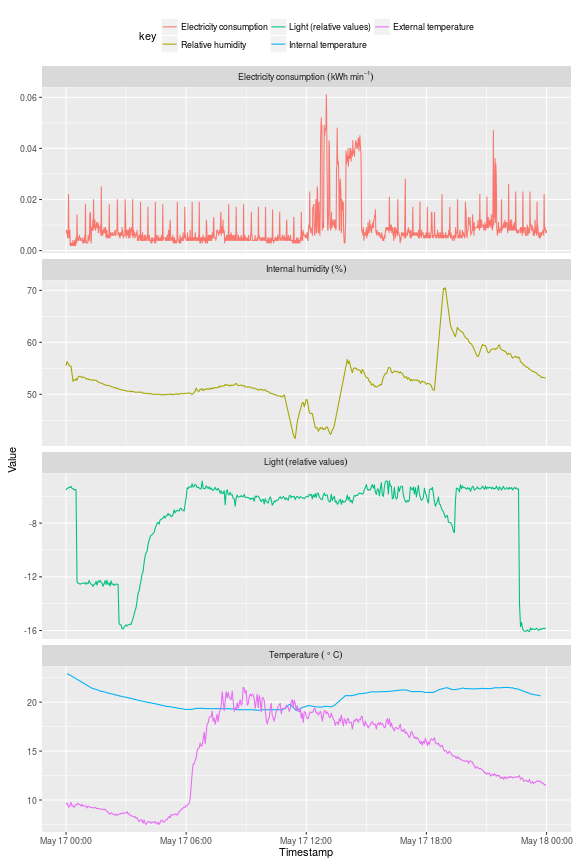
So what does a single day look like? Picking a day (almost) at random: 17 May 2015:
Electricity
The electricity plot shows that the bulk of usage occurred around midday, and I would guess that the sustained peak just before 15:00 was the electric oven. It looks like I did a bit more cooking just after nine - since my heating is gas, major spikes in usage tend to be from the oven, microwave, vacuum, or hairdrier!
I still don’t know what the periodic spikes throughout the day are. I had thought that this was my fridge freezer, but a recent experiment has ruled this out. Whatever it is, it accounts for a reasonable proportion of my daily electricity usage.
Humidity
The relative humidity plots are not often that useful, and are strongly correlated with temperature. Sometimes it is possible to detect someone getting out of the shower (humidity rises), or a window being opened (humidity usually drops). This may be what happened at around 11:00 - a steep drop in humidity, and a small drop in internal temperature suggests that I opened a downstairs window or door, which was perhaps closed around 13:30 when temperature climbed with humidity. What caused the steep rise in humidity around 18:00 is unclear.
Light
The light plot is perhaps the most telling. Here I have log transformed and multiplied by -1 (there are probably better ways of standardising this).
The sharp step shortly after midnight is the living room lights going off, but it looks like I had a pretty late night in the office (with the door open) until just before 03:00. The sun slowly started to rise between 03:00 and 04:00, and the day remained light until sometime after 19:00, when I turned the living room lights on again, before going to bed at a much more urbane 23:00-ish.
Temperature
The temperature plots don’t show too much this time of year, except that it was a pretty warm day, and at times it was warmer outside the house than in. The external temperature sensor is not very well shielded however, and it probably reads a few degrees higher than the ambient air temperature. In future I will install a few more external temperature sensors, and get an averaged reading.
Next steps
I’d like to summarise some findings from these data in an info-graphic. What, I think, this little experiment has already shown though, is just how much information can be gleaned from an ensemble of simple and inexpensive sensors. Information about what time I get up, when I cook, open doors, have showers, turn on the heating, etc is all possible.
With some training data, this dataset opens itself up to some very interesting machine learning possibilities; and is exactly the reason why I don’t (at present) intend to make the dataset freely available. Building these sensors was incredibly cheap, and with the release of the Raspberry Pi zero, just got even cheaper. I’m now looking to build more sensors for elsewhere in the home to give me additional streams of data.